OGUC 3D: zoning as a map, not a PDF
Finding out what can be built on a Chilean plot means visiting five separate agencies. I'm building the platform that brings it all onto a three-dimensional map.
To find out what can be built on a plot of land in Chile you have to visit five different websites. None of them talk to each other, each uses its own format, and none shows you the result over the real place. That's what I'm trying to fix with OGUC 3D.
The OGUC —Chile's General Ordinance of Urbanism and Construction, the regulation that has set the country's building rules since 1992— is only one part. On top of it sit communal zoning plans, urban limits, heritage protection, wetlands, protected areas. All of it exists, all of it is public, and still, assembling the full picture of one site can take you an entire afternoon.
The information exists. It's just scattered
This isn't a complaint about missing data. Chile has a good amount of territorial information published, and several agencies have done serious work putting it online. The problem is that each layer lives with the institution that produces it, with its own viewer, its own scale and its own update cycle.
| What you need to know | Where it lives today |
|---|---|
| Zoning, land use, buildable area | MINVU's Open Data Geoportal and the territorial planning instruments catalog |
| Urban limits (communal, intercommunal, metropolitan) | The same MINVU services, in separate layers |
| Typical zones, historic monuments, nature sanctuaries | National Monuments Council geoportal |
| Declared urban wetlands | Ministry of the Environment's urban wetlands program |
| Protected areas, priority sites, RAMSAR sites | SIMBIO, from the same ministry |
Five different doors for a single plot. And once you finally gather everything, the result is still a stack of flat polygons you have to mentally translate into a building. That last step —the one that actually matters— no platform does for you: the architect does it, by hand, with whatever experience they have.
What I learned from OGUC Ilustrada
Before writing a line of code I looked closely at OGUC Ilustrada, published by Catálogo Arquitectura. Their contribution was understanding that the problem wasn't access to the regulation —it's published, it's free— but understanding it: they took the text and drew it, volume by volume, until a second-year student could follow it.
That's exactly the gap I care about. They closed it with drawing; my bet is to close it with territory. Not explaining the rule in the abstract, but showing it applied to the specific site you're looking at, in three dimensions and over the city as it exists today.
How it looks
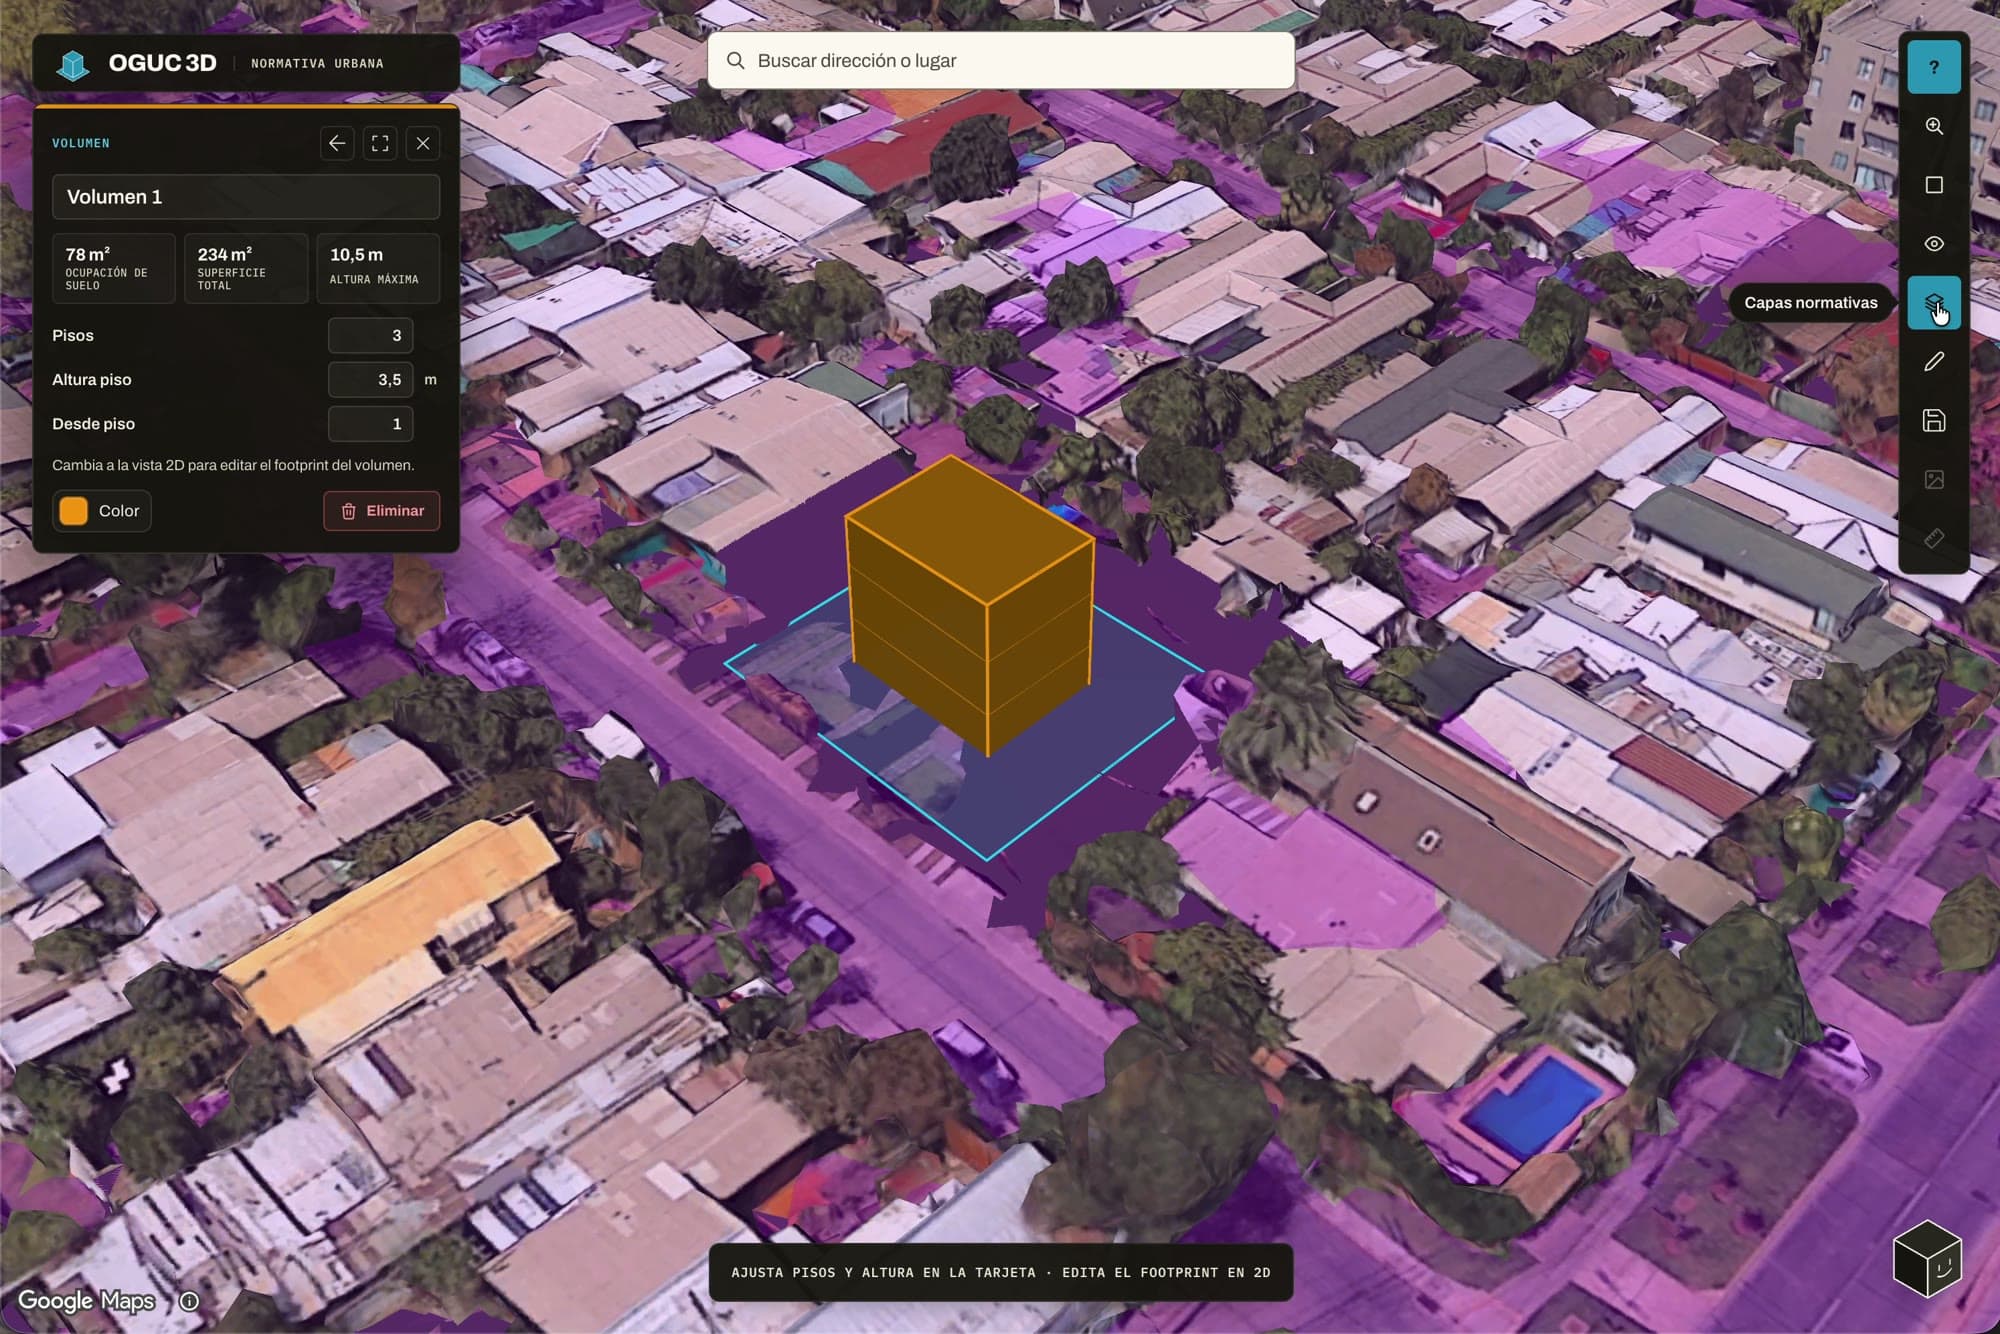
It works like a map, not like a document. You search an address, switch on the layers you care about and see what falls on the plot: whether it's inside the urban limit, whether it touches a heritage zone, whether there's a declared wetland next door. Each layer states which agency it comes from, so you know who you're trusting.
From polygon to massing
This is the part I cared about most. You draw the plot, define volumes, and the platform returns area, site coverage, total built area and floor count as you move them. It doesn't replace the preliminary project or the municipal review, but it turns a question that today takes days —does this pencil out or not?— into something you answer in the first meeting, standing on the real site.
Why Valdivia is a good test
I picked Valdivia to test because that's where the problem shows itself without explanation. It's a city built among wetlands, with Law 21.202 on urban wetlands operating over the same ground the zoning plan regulates. Two rules, two ministries, two viewers. On the map, the overlap is obvious in two seconds.
The green area that isn't there
There's one scene that follows me around: a plan says “green area” and the satellite shows bare dirt, not a single tree. The regulation declares it green; the city doesn't. We decide on the first and live in the second.
As long as the information lives in flat plans, that distance is invisible. On a 3D model with real imagery underneath, it's immediate. This isn't an aesthetic detail: it's the difference between planning on paper and planning on the territory.
Rules written for the technology of their time
I was recently in Guadalajara talking with people from Tec de Monterrey's Observatorio de Ciudades, who worked on this: measuring real pedestrian accessibility in a focused study, computing the effective route over infrastructure that actually exists instead of the straight line.
The example that stuck with me: a school inside the radius the rule demands —say 500 meters from a bus stop— complies without discussion. But walking it, around the block and crossing where you can, the real distance came out three times longer. The rule is met all the same; the kid walks three times as far.
The rules we have are the ones the technology of their time allowed us to write.
When the available tool was a printed plan, a 500-meter radius was a reasonable approximation: you drew it with a compass. Today we have complete street networks, routing algorithms and computing power to spare. We could write rules in real walking distance, in travel time, in effective accessibility.
But the floor is missing. You can't regulate with computed criteria on a base that still lives in PDFs and scattered shapefiles. First the digital base, complete and public; then the smart rules. In that order, not the other way around.
Who I'm building this for
I started thinking about architects, because that's where I come from and because we're visual people: we grasp a massing faster than a buildability table. But during the MDI at ESE Business School, Universidad de los Andes, it became clear the need is much wider.
- Architecture practices: answering “does this work?” in the first meeting, not a week later.
- Developers: assessing plots with the regulation on top before committing capital.
- Municipal building departments: reviewing on the same base the applicant used.
- Students: learning the regulation by seeing it applied, not by memorizing articles.
When I posted the first progress on LinkedIn, the reaction surprised me: comments came from all four groups, public-sector people included. That confirmed the pain isn't one guild's, it's the whole system's.
Where I want this to go
I've been invited to join the innovation committee of the AOA, Chile's Association of Architecture Practices, and that's where I want to push this: so it doesn't stay a nice private initiative. The goal is for the country's regulatory information to be available in a digital, three-dimensional, public format, and for municipal departments and agencies to work from the same base as those of us who design.
I don't think a platform fixes urban planning. I do think that without a common digital base, any regulatory improvement we attempt in the coming years will keep hitting the same wall: data that doesn't talk to itself.
Ideas and learnings, once a month.